“Grafana vs Tableau – Exploring 10 key insights to help you choose the best data visualization tool for your business in 2024. Understand how each platform fits different business needs and make an informed decision, whether you’re a startup or an enterprise.“
TL;DR: Quick Summary of Grafana vs Tableau
Grafana and Tableau are powerful data visualization platforms, but they serve very different purposes. Grafana is open-source and excels at real-time monitoring, making it a top choice for IT professionals and developers who need custom dashboards and real-time data visibility. Tableau is a commercial platform known for its ease of use and advanced analytics, ideal for business users and data analysts who need interactive dashboards and actionable insights. In essence, Grafana is best suited for operational monitoring, while Tableau is the go-to tool for business intelligence and storytelling with data. Choosing the right tool depends on your business needs, technical expertise, and the type of data you’re working with.
Table of Contents
Introduction: Data Visualization’s Critical Role in 2024
In the modern business landscape, data is more than a resource—it’s the lifeblood of decision-making. Organizations across industries collect massive amounts of data every day, and the ability to turn this raw data into actionable insights has become a competitive differentiator. Data visualization tools like Grafana and Tableau help businesses unlock the true potential of their data by providing platforms that transform complex datasets into clear, meaningful visualizations.
However, not all data visualization tools are created equal. Grafana vs Tableau are two of the most popular platforms, yet they serve different purposes and cater to different types of users. Choosing between these tools requires a clear understanding of your specific business needs, technical capabilities, and data use cases. In this guide, we’ll dive deep into the 10 key insights you need to know when comparing Grafana vs Tableau, helping you make an informed decision for 2024 and beyond.

What is Grafana? Key Strengths and Use Cases
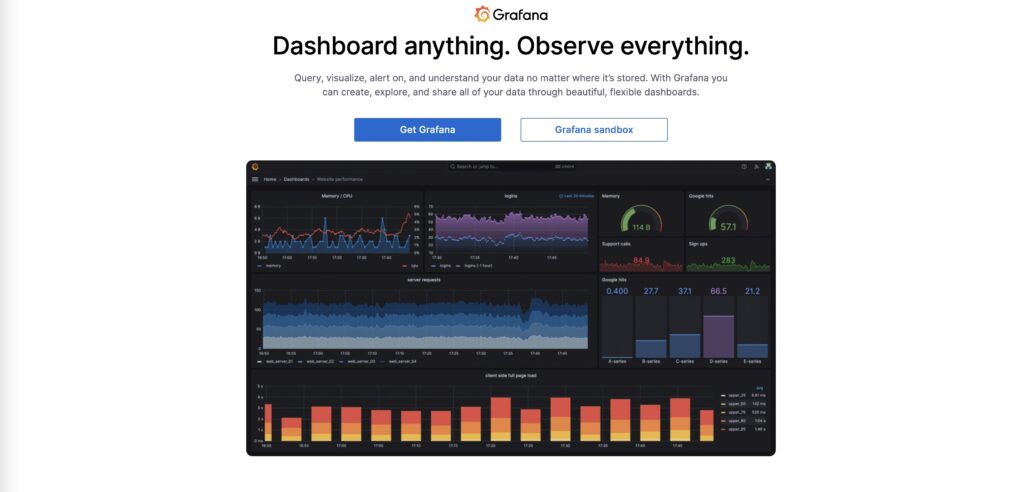
Grafana is an open-source platform that excels at real-time data monitoring, particularly for time-series data. Initially designed to monitor infrastructure and application performance, Grafana has evolved into a multi-purpose tool that integrates with various data sources, enabling businesses to create custom dashboards that suit their specific needs.
Key Features of Grafana:
- Real-Time Data Monitoring: Grafana is designed to visualize real-time data from multiple sources, making it ideal for monitoring system performance, uptime, and server health.
- Customizable Dashboards: Users have full control over how their data is displayed, with the ability to create custom visualizations, add plugins, and tweak the interface to fit specific requirements.
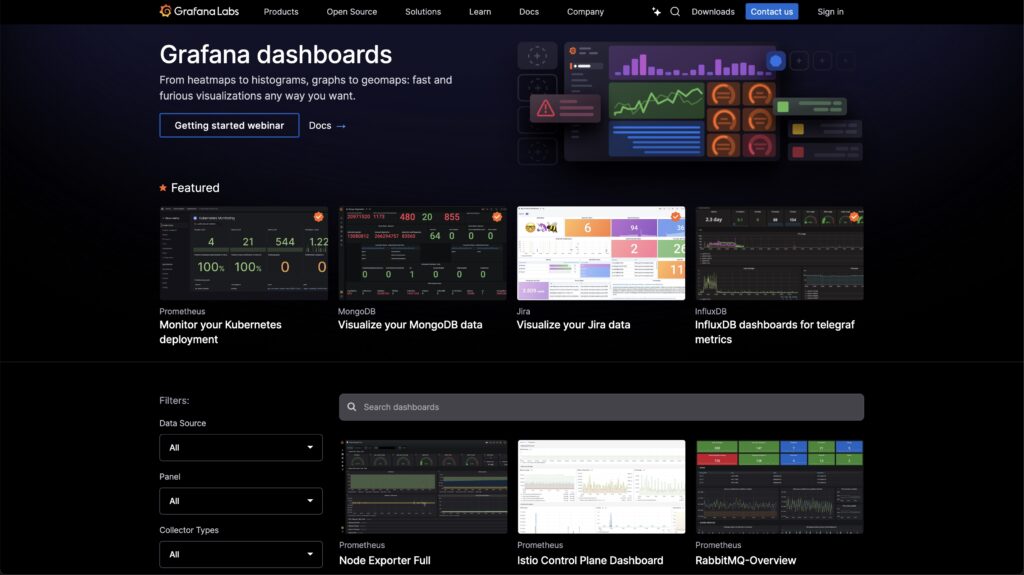
- Integration with Technical Data Sources: Grafana works seamlessly with a wide range of technical data sources like Prometheus, Elasticsearch, and MySQL, allowing businesses to track performance metrics and other operational data.
Use Cases for Grafana:
Grafana is perfect for IT teams, DevOps engineers, and technical users who need to track system health, monitor application performance, and visualize metrics in real time. It’s also highly effective in industries where real-time monitoring is critical, such as e-commerce, telecommunications, and SaaS.
What is Tableau? Business Intelligence Simplified
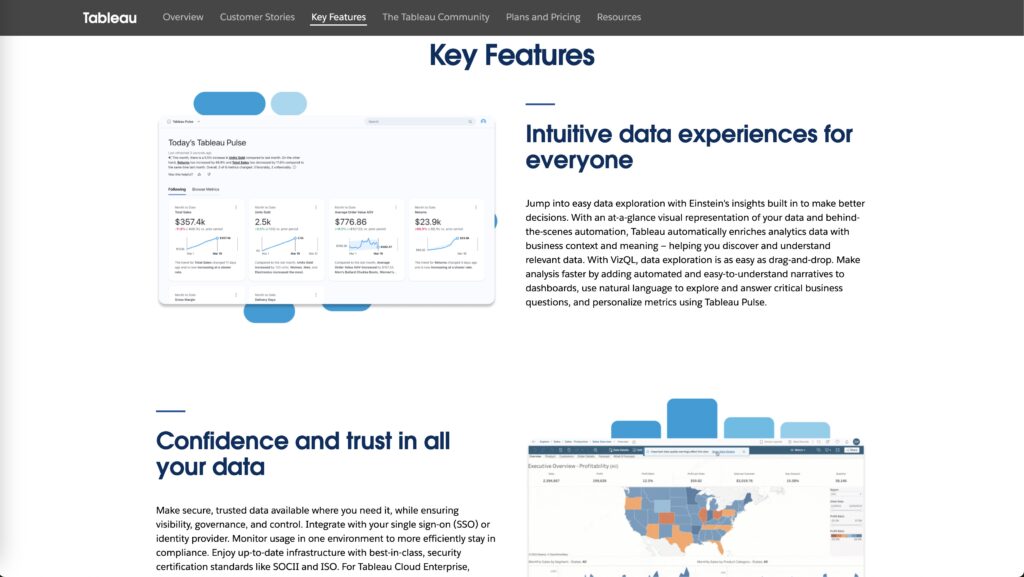
Tableau is a commercial platform known for its powerful business intelligence and ease of use. It’s designed to help businesses turn their data into actionable insights without requiring deep technical expertise. Tableau’s drag-and-drop interface makes it easy for business users to create interactive dashboards that not only visualize data but also allow for deep exploration and analysis.
Key Features of Tableau:
- Drag-and-Drop Interface: Tableau is known for its user-friendly design, allowing users to create sophisticated dashboards by simply dragging and dropping elements onto the canvas.
- Advanced Analytics: Tableau offers a suite of advanced analytics tools, including predictive analytics, trend analysis, and statistical modeling, making it a powerful tool for business users who need to derive insights from complex datasets.
- Interactive Dashboards: Tableau allows users to create highly interactive visualizations where viewers can filter data, drill down into details, and customize their view on the fly.
Use Cases for Tableau:
Tableau is perfect for businesses that need to perform complex data analysis, particularly in areas like finance, sales, and marketing. Its ability to turn raw data into compelling visual stories makes it ideal for data analysts, business executives, and decision-makers who need clear insights to drive strategy.
Grafana vs Tableau: 10 Key Differences
Now that we’ve explored the basics of both platforms, let’s dive into the 10 key differences between Grafana vs Tableau, helping you understand which tool is best suited for your business needs.
Flexibility and Customization: Grafana vs Tableau
Grafana: As an open-source platform, Grafana offers unparalleled flexibility and customization. Users can modify the platform’s code, create custom plugins, and develop unique visualizations tailored to their needs. This level of flexibility makes Grafana an ideal choice for technical teams who require full control over their data visualization tools.
Tableau: While Tableau offers customization options, it is more limited compared to Grafana. Tableau’s focus is on ease of use, and its customization options are confined to what the platform provides. However, for most business users, Tableau’s drag-and-drop interface provides more than enough customization for creating detailed, interactive dashboards.
Best for:
- Grafana: Businesses that require extensive customization and technical control over their data dashboards.
- Tableau: Business users who prioritize ease of use and a polished, user-friendly interface.
Ease of Use and User Interface: Grafana vs Tableau
Grafana: Grafana’s interface is functional but geared toward technical users. While it provides a powerful platform for real-time monitoring, its learning curve is steep for users without technical expertise. Grafana’s interface is built for performance monitoring and operational data, which can make it overwhelming for non-technical users.
Tableau: In contrast, Tableau’s interface is designed for simplicity. Its drag-and-drop functionality makes it easy for business users to create advanced dashboards without needing to write code. This makes Tableau a popular choice for non-technical users such as data analysts, marketers, and business executives.
Best for:
- Grafana: Teams comfortable with coding and technical dashboards.
- Tableau: Business users looking for an intuitive, easy-to-use data visualization tool.
Data Sources and Integrations: Grafana vs Tableau
Grafana: One of Grafana’s biggest strengths is its ability to integrate with multiple data sources, particularly technical platforms such as Prometheus, Elasticsearch, and InfluxDB. It supports both open-source and proprietary databases, making it ideal for businesses that need to aggregate real-time data from various systems into one unified dashboard.
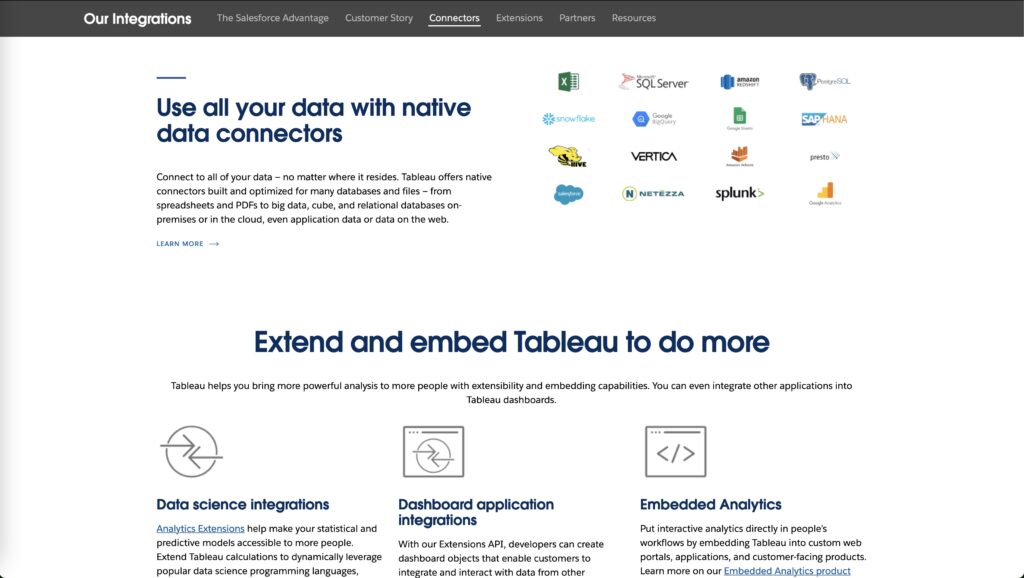
Tableau: Tableau is designed to integrate with a wide range of business data sources, including CRM systems like Salesforce, ERP platforms, SQL databases, and cloud services like Google Analytics. This makes Tableau an excellent choice for businesses that rely on diverse data sources to inform their business intelligence.
Best for:
- Grafana: Businesses needing to pull in technical data from multiple sources for real-time monitoring.
- Tableau: Companies needing to integrate business data from corporate systems for comprehensive analytics.
Visualization and Interactivity: Tableau vs Grafana
Tableau: Tableau leads the way in data visualization, offering a wide variety of chart types, graphs, and visual storytelling tools. Its dashboards are interactive, allowing users to drill down into data, apply filters, and explore information from different angles. Tableau’s visualizations are designed to be dynamic, making it easy for business users to uncover insights and present data effectively.
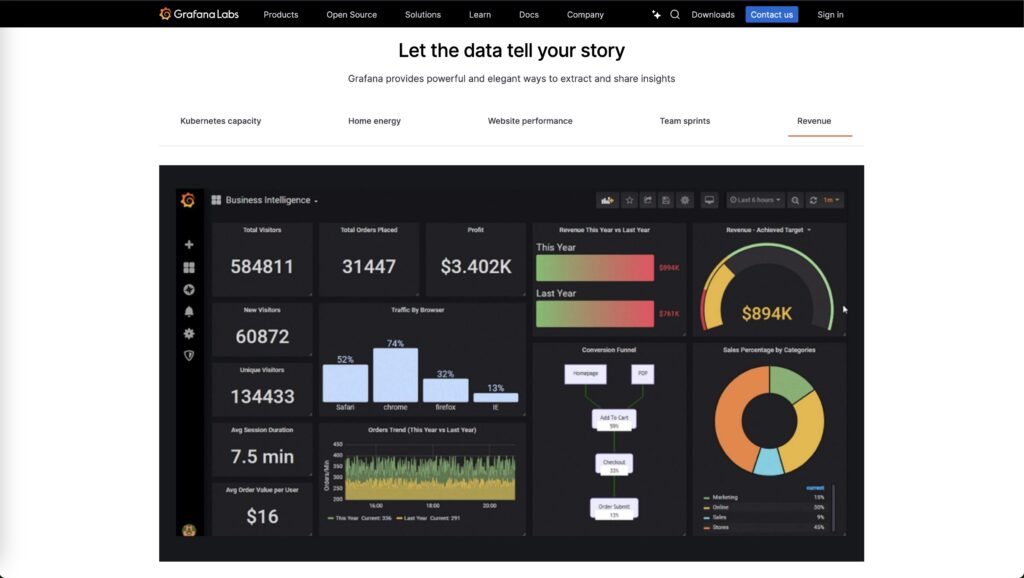
Grafana: While Grafana is excellent for visualizing real-time metrics, it doesn’t offer the same level of interactivity or variety of chart types as Tableau. Grafana’s strength lies in operational dashboards where real-time data is displayed for monitoring purposes, rather than interactive data exploration.
Best for:
- Grafana: Operational dashboards focused on real-time metrics.
- Tableau: Interactive, visually rich dashboards for business intelligence.
Data Analytics and Insights: Grafana vs Tableau
Tableau: Tableau’s strength lies in its ability to provide deep data insights through advanced analytics. Users can leverage predictive analytics, statistical analysis, and trend forecasting to make data-driven decisions. Tableau also allows users to perform complex queries and explore data in ways that go beyond simple visualizations, making it a powerful tool for business intelligence.
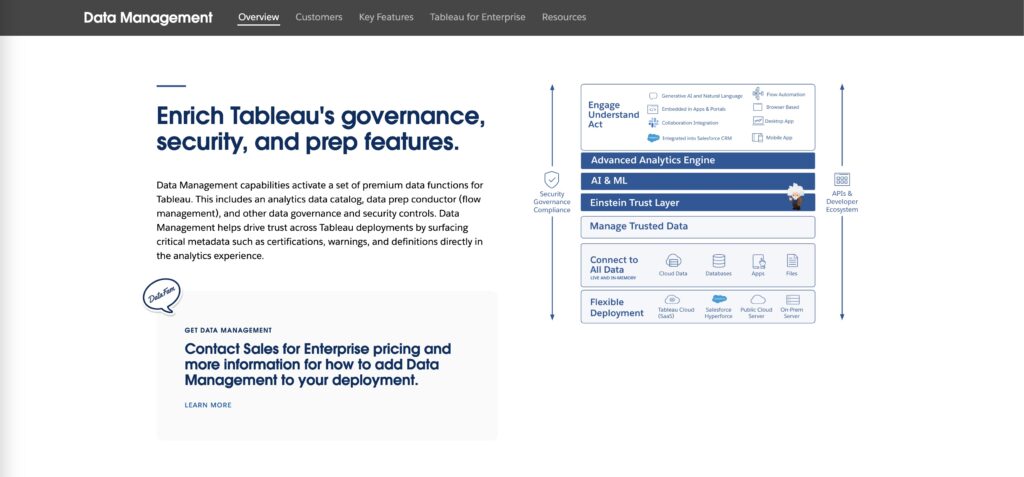
Grafana: While Grafana is excellent for visualizing data in real time, its analytics capabilities are more limited compared to Tableau. Grafana is primarily focused on monitoring operational data, and while it can generate insights from these metrics, it lacks the advanced analytics features that make Tableau a leader in business intelligence.
Best for:
- Grafana: Real-time data monitoring and operational insights.
- Tableau: Advanced business intelligence and deep data analytics.
Community Support and Documentation: Grafana vs Tableau
Grafana: As an open-source platform, Grafana has a large, active community of users and developers who contribute plugins, updates, and support. This makes it easy for businesses to find solutions to common problems and extend the platform’s functionality. However, because much of the support comes from the community, businesses may need to rely on forums and community resources for assistance.
Tableau: Tableau offers premium customer support alongside a wealth of official documentation and training materials. In addition to its dedicated customer service, Tableau provides users with access to its extensive knowledge base, including tutorials, webinars, and certification programs. For businesses that require hands-on support, Tableau’s structured offerings make it a safer bet.
Best for:
- Grafana: Technical users who are comfortable relying on community-driven support.
- Tableau: Businesses that need comprehensive customer support and structured training.
Deployment Options and Scalability: Grafana vs Tableau
Grafana: Grafana provides flexible deployment options, supporting both on-premise and cloud-based solutions. Its flexibility allows businesses to scale their monitoring solutions as their infrastructure grows. Grafana is particularly suited for companies that operate hybrid environments, as it can seamlessly integrate with both on-premise and cloud systems.
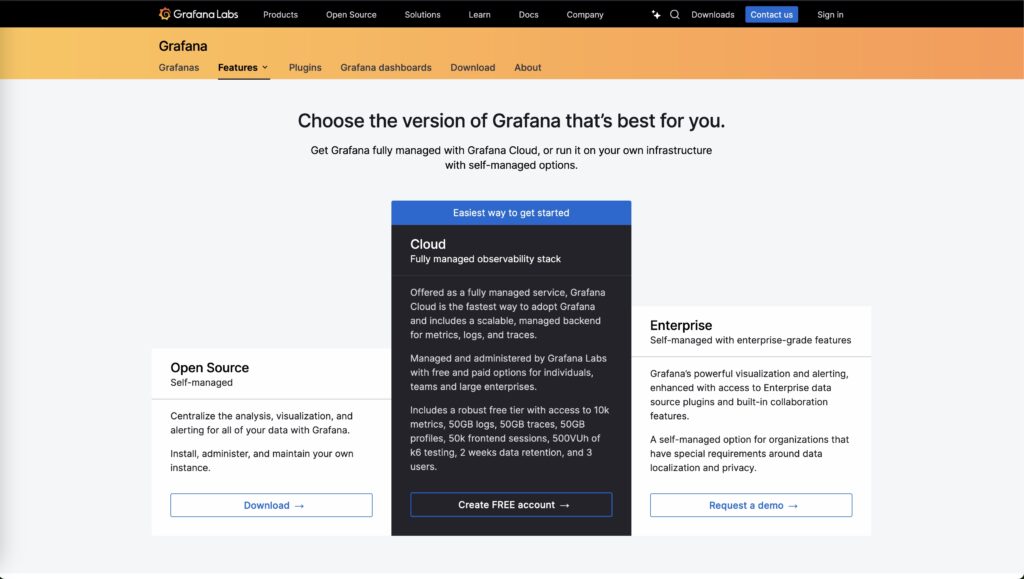
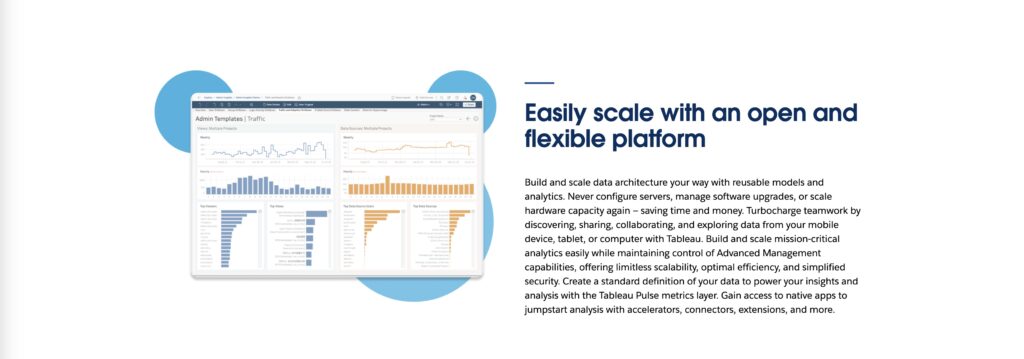
Tableau: Tableau also offers scalability, but it is more focused on cloud-based deployments. With options like Tableau Server and Tableau Online, businesses can scale their analytics infrastructure as they grow, ensuring that data is accessible across teams and locations. For enterprises with distributed teams, Tableau’s cloud solutions offer the scalability needed to handle large datasets.
Best for:
- Grafana: Businesses needing flexible deployment options, including on-premise and cloud integration.
- Tableau: Companies requiring cloud-based solutions for scalable business intelligence.
Collaboration and Sharing: Grafana vs Tableau
Grafana: While Grafana allows users to share dashboards, it lacks some of the advanced collaboration features that Tableau offers. Grafana is more focused on providing technical users with operational insights rather than enabling collaboration between departments.
Tableau: Tableau excels in collaboration, making it easy for teams to share dashboards and insights across the organization. With Tableau Server and Tableau Online, users can share interactive dashboards with colleagues, enabling real-time collaboration and ensuring that key stakeholders are always informed.
Best for:
- Grafana: Technical teams sharing operational dashboards.
- Tableau: Businesses needing robust collaboration features to share insights across departments.
Security and Governance: Grafana vs Tableau
Grafana: Grafana’s enterprise version offers robust security features, including role-based access control, data encryption, and audit logs, making it suitable for businesses that need to monitor sensitive infrastructure and comply with security regulations.
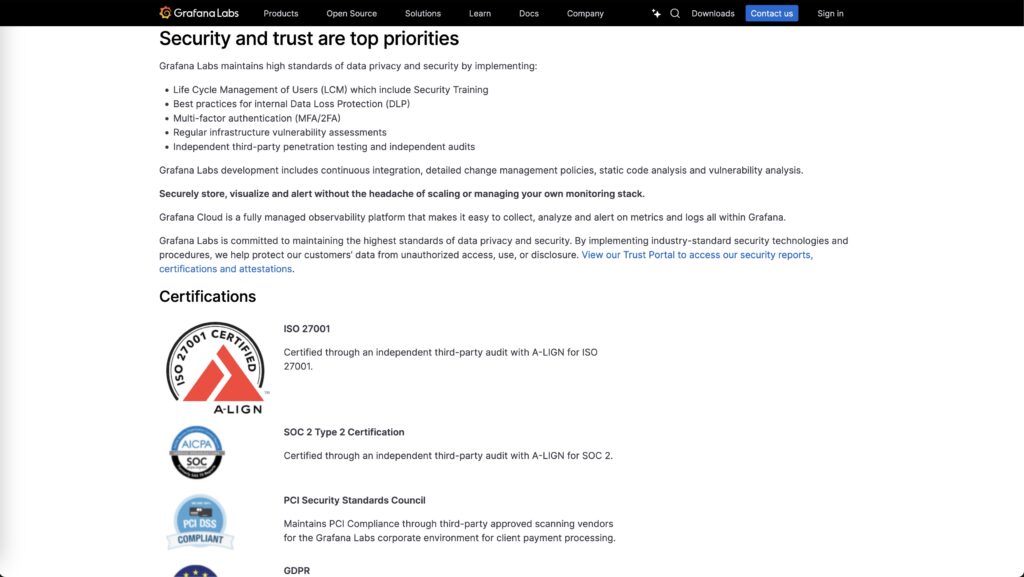
Tableau: Tableau provides enterprise-grade security features, including encryption, secure access controls, and governance tools, which help businesses comply with regulatory requirements and manage data access across departments. For organizations handling sensitive business intelligence data, Tableau’s governance capabilities ensure that data is secure and accessible only to authorized users.
Best for:
- Grafana: IT teams needing secure infrastructure monitoring.
- Tableau: Businesses requiring comprehensive governance for business data.
Pricing Models and Value for Money: Grafana vs Tableau
Grafana offers an open-source version that is free to use, making it an attractive option for startups and small businesses with limited budgets. Even the paid enterprise version is affordable compared to other tools, making Grafana a cost-effective solution for real-time monitoring.
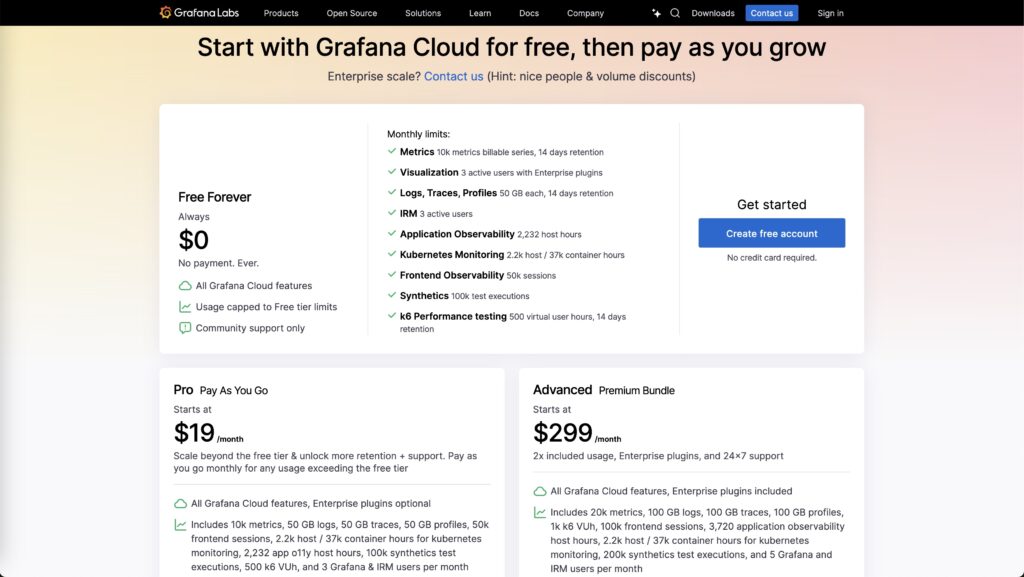
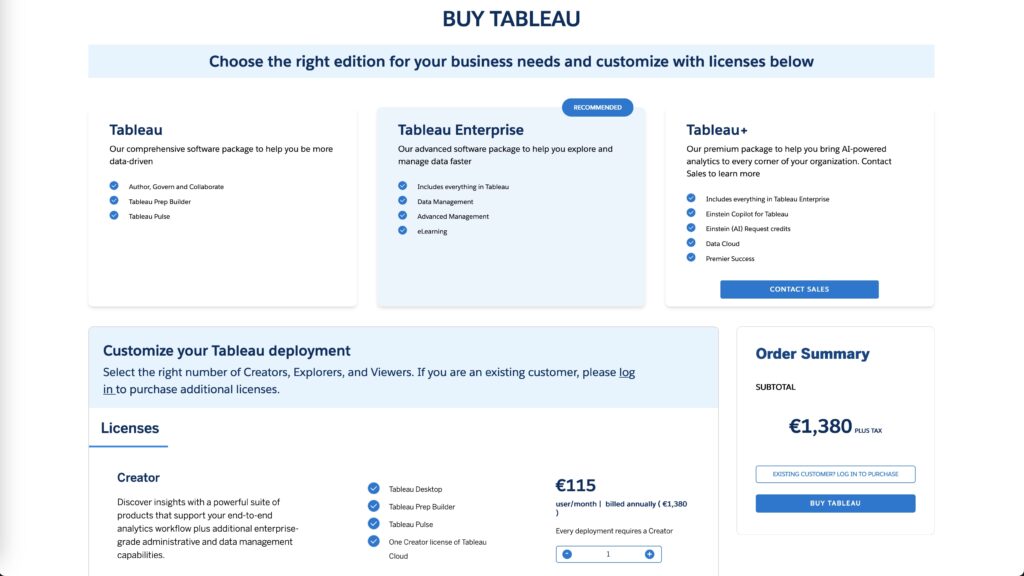
Tableau operates on a premium pricing model, with different tiers depending on the features and number of users. While more expensive than Grafana, Tableau’s pricing reflects the platform’s advanced analytics, ease of use, and collaboration features. It’s a better choice for businesses that are willing to invest in a polished, comprehensive business intelligence tool.
Best for:
- Grafana: Startups and businesses looking for cost-effective, open-source solutions.
- Tableau: Enterprises that prioritize advanced analytics and are willing to invest in premium features.
Choosing Grafana vs Tableau Based on Business Stage
Now that you have a detailed understanding of Grafana vs Tableau, it’s important to consider which tool fits your business’s current stage and long-term goals.
For Startups and Small Businesses: Grafana vs Tableau
Startups and small businesses often have limited budgets and specific needs when it comes to data visualization. Grafana is the ideal choice for businesses that need flexibility and real-time monitoring without incurring high costs. Its open-source model allows startups to build custom dashboards tailored to their exact needs, and its free version provides plenty of functionality.
Tableau, while highly effective, might be overkill for startups with limited data needs. However, for small businesses that need to present polished reports or conduct business intelligence, Tableau’s ease of use and powerful analytics might justify the investment.
Best Choice: Grafana for flexibility and cost-effectiveness; Tableau for small businesses focused on business intelligence.
For Growing and Mid-Sized Companies: Tableau vs Grafana
As businesses grow, so do their data needs. Tableau is an excellent fit for growing businesses that require advanced analytics and user-friendly dashboards. Its scalability ensures that businesses can manage larger datasets and collaborate across teams, making it a good fit for mid-sized companies moving toward more complex data analysis.
Grafana remains a valuable option for businesses with strong technical teams that need to monitor operational data. However, mid-sized companies that require more sophisticated analytics and collaboration features will likely find Tableau more suitable.
Best Choice: Tableau for scalable business intelligence; Grafana for technical teams needing operational data monitoring.
For Large Enterprises: Tableau vs Grafana
Large enterprises managing vast amounts of data across multiple departments will benefit from Tableau’s advanced analytics and collaboration features. Its ability to scale across teams, combined with cloud-based deployment options, ensures that data can be shared seamlessly across the organization. Tableau also offers the security, governance, and compliance features needed for enterprise-level data management.
Grafana remains a strong option for enterprises with technical teams that need to monitor system performance and operational metrics. For real-time monitoring and infrastructure health, Grafana is hard to beat. However, for comprehensive business intelligence and deep data analysis, Tableau is the better choice.
Best Choice: Tableau for enterprise-wide business intelligence; Grafana for real-time system monitoring at scale.
Conclusion: Grafana vs Tableau – Making the Right Choice in 2024
When deciding between Grafana vs Tableau, it’s crucial to consider your business’s specific needs, technical capabilities, and long-term goals. Grafana is a flexible, cost-effective solution for real-time monitoring, making it ideal for startups, IT teams, and businesses that need custom dashboards. Tableau, on the other hand, offers powerful analytics, ease of use, and robust collaboration features, making it the go-to tool for business intelligence and data-driven decision-making.
By understanding the key differences between these two platforms, you can choose the right tool to help your business leverage its data more effectively in 2024 and beyond.
Top 3 Alternatives to Grafana and Tableau
If neither Grafana vs Tableau meets your needs, here are three excellent alternatives:
- Power BI: Microsoft’s business intelligence platform, integrated tightly with Office 365, offering strong data visualization and reporting tools at a competitive price.
- Looker: A data exploration platform owned by Google, ideal for businesses already using Google Cloud services.
- Qlik Sense: A data analytics and visualization tool that focuses on AI-driven insights and innovative data discovery features.

