“Quicksight vs Tableau: Discover which BI tool is best for your business in 2024! Read this comprehensive guide comparing features, pricing, and more.”
TL;DR Summary:
Quicksight and Tableau are powerful business intelligence (BI) tools, but they cater to different user needs. Quicksight is more suited for smaller businesses or those already integrated with AWS services, offering simplicity and affordability. On the other hand, Tableau excels for larger enterprises that require advanced analytics and more customization options. Read on for a detailed comparison and recommendations based on your business stage.
Table of Contents
Introduction to Quicksight vs Tableau
As businesses become more reliant on data to drive decision-making, choosing the right business intelligence (BI) tool becomes a critical factor in maintaining a competitive edge. In 2024, Quicksight vs Tableau continue to be two leading contenders in the BI market, each catering to distinct types of businesses and data needs. This guide explores the strengths and limitations of each tool in detail, offering insights into which might be the right fit for your organization.
Both Quicksight vs Tableau offer robust data visualization capabilities, but their target users, pricing models, and functionality differ considerably. In this post, we’ll walk through the most important aspects of each platform, from ease of use to pricing, and help you decide which is more suitable for your business needs—whether you’re a small startup or a large enterprise looking for sophisticated analytics.

Quicksight Overview
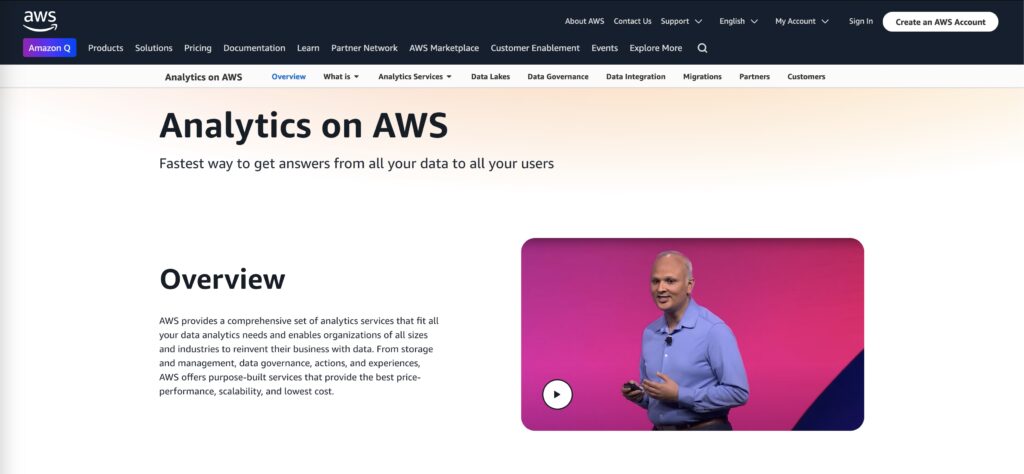
Amazon Quicksight is Amazon Web Services’ (AWS) cloud-native business intelligence solution. It’s designed to be scalable, cost-effective, and easily accessible to users of all technical levels. Quicksight is especially appealing to businesses that already use AWS services because of its seamless integration with Amazon’s extensive ecosystem, including S3, Redshift, and RDS.
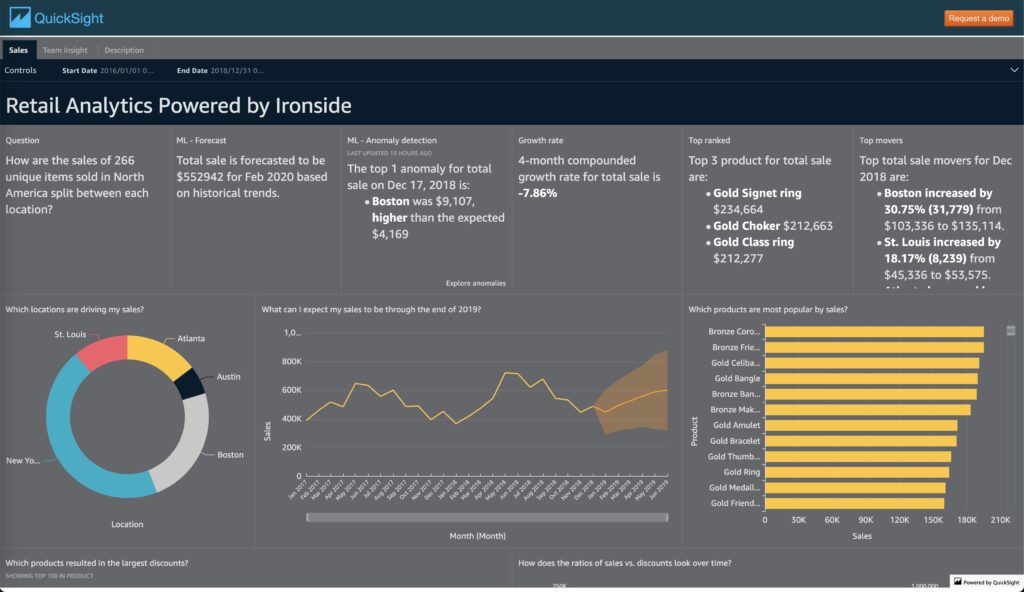
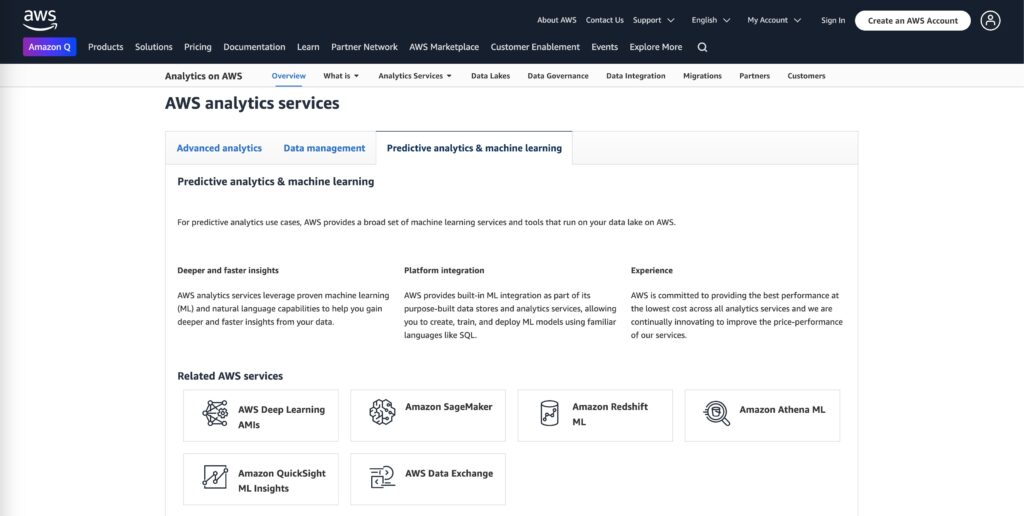
One of Quicksight’s standout features is its machine learning-powered insights. These allow users to detect patterns, forecast trends, and identify anomalies without needing a data science background. This feature is particularly beneficial for small and medium-sized businesses that may not have dedicated data analysts on staff. With Quicksight, even non-technical team members can uncover data insights quickly and easily, which democratizes access to valuable business information.
Scalability and Pricing Flexibility
Another key benefit of Quicksight is its pay-per-session pricing model. Instead of a traditional subscription, businesses only pay for the sessions they use. This makes Quicksight a highly cost-effective option for companies that don’t require constant access to a BI tool. Small businesses or teams with sporadic reporting needs find this model ideal, as it helps avoid paying for idle tools.
Additionally, Quicksight’s scalability means that as your business grows, it can handle larger datasets and more users without performance degradation. The flexibility in pricing and scale is perfect for businesses that are expanding but still want to maintain budget-friendly operational tools.
Tableau Overview
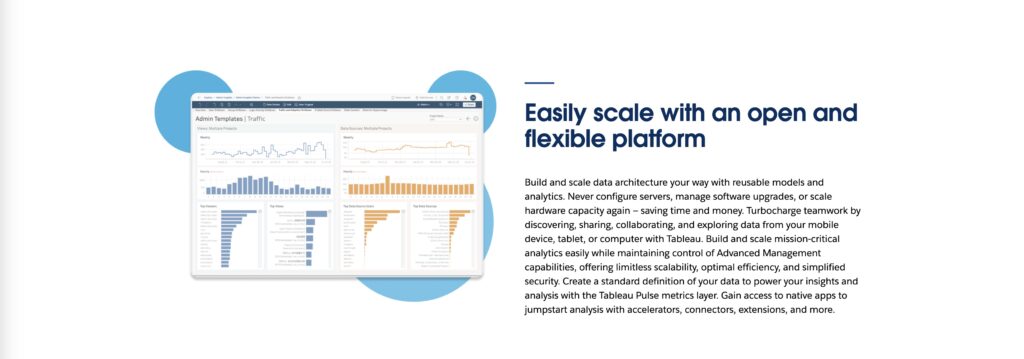
Tableau, on the other hand, has long been known as the go-to tool for deep data visualization and analytics. Acquired by Salesforce, Tableau is widely regarded for its advanced customization options, interactive dashboards, and powerful data manipulation capabilities. Tableau’s visual analytics features allow businesses to transform complex data sets into compelling visual stories that can guide decision-making at every level of the organization.
Tableau’s strength lies in its flexibility and depth. Users can create highly interactive, custom dashboards that suit various analytical needs. Whether it’s exploring raw data through interactive visualizations or building sophisticated, multi-layered reports for stakeholders, Tableau shines in turning data into actionable insights.

Powerful Integrations and Flexibility
Tableau integrates smoothly with a wide range of databases, including Excel, Google Sheets, SQL, and Salesforce, making it an extremely versatile tool for businesses with diverse data sources. This broad compatibility, coupled with its rich library of visualizations, makes Tableau a top choice for companies that need detailed, customizable reports.
Its on-premise and cloud-based deployment options provide businesses the flexibility to host Tableau on their own infrastructure or leverage cloud-based solutions. This makes it ideal for larger organizations with more stringent security or compliance requirements, as they can control where their data is stored and accessed.
Features Comparison:
User Interface and Ease of Use: Quicksight vs Tableau
When comparing Quicksight vs Tableau in terms of ease of use, Quicksight is tailored more for non-technical users and business professionals who need fast, actionable insights without a steep learning curve. Its drag-and-drop interface is simple and intuitive, making it accessible for users across different departments—even those without extensive experience in data analysis.
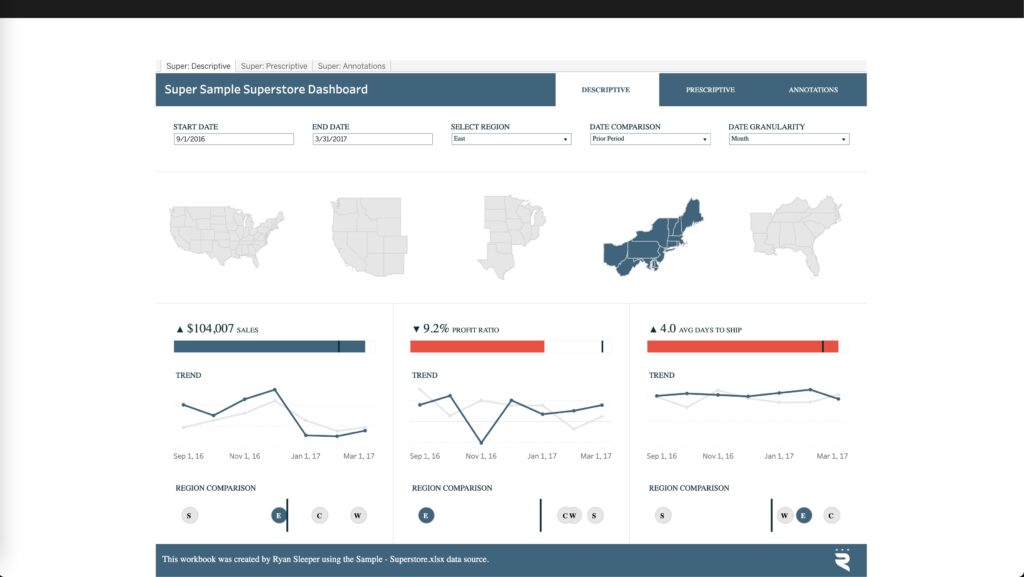
Tableau, on the other hand, requires a bit more of a learning investment. While not overly complicated, its interface is designed for users who want to build highly customized reports and visualizations. Once users become familiar with Tableau’s workspace, they can unlock a wide array of features that allow for deep data exploration. This makes Tableau better suited for users with advanced data skills or businesses that require more detailed reporting capabilities.
In terms of usability, Quicksight wins for small businesses or teams that need quick insights without advanced customization. Tableau is ideal for power users or teams with dedicated data analysts who need more advanced tools to manipulate and visualize data.
Data Visualization Capabilities: Quicksight vs Tableau
Data visualization is the core strength of both tools, but Tableau takes it to another level with its dynamic, interactive visualizations. Tableau’s ability to create detailed, multi-dimensional visualizations—from geographic maps to interactive dashboards—makes it a go-to for businesses that need to present complex data in a clear and engaging way.
Quicksight’s visualizations are more basic but still effective for businesses that don’t need complex data representations. It offers the standard set of charts and graphs, such as pie charts, bar charts, and heat maps, which are easy to create and manipulate.
The advanced features that Tableau provides—such as custom calculations, parameters, and dashboard actions—allow for a deeper level of interactivity and user engagement with the data. For example, a sales team could use Tableau to create a real-time, interactive dashboard that drills down into regional sales performance, while Quicksight would be better for quickly generating a monthly report.
Integration with Other Tools: Quicksight vs Tableau
In terms of integrations, Quicksight vs Tableau diverge significantly based on their ecosystems. Quicksight excels in integrating seamlessly with AWS services, making it the natural choice for businesses already invested in the Amazon ecosystem. If you’re working with AWS products like S3, Redshift, or RDS, Quicksight makes it easy to pull in data from these sources and generate visualizations within the same platform.
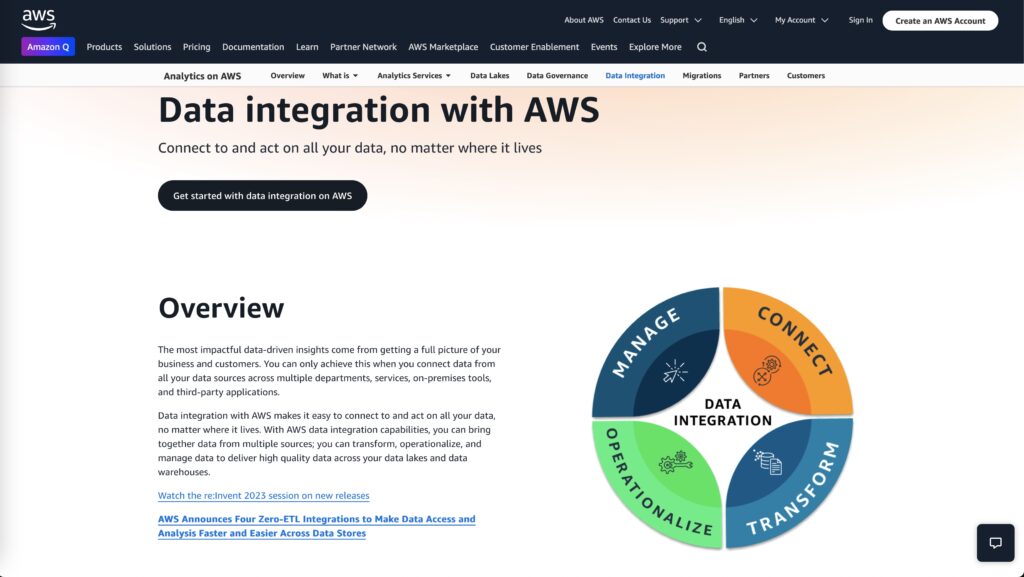
Tableau offers wider integration options, supporting databases like Google Sheets, Microsoft SQL Server, Excel, Salesforce, and others. Its ability to connect with various data environments and support for third-party plugins make it ideal for businesses that rely on a diverse set of data sources. This flexibility allows Tableau users to bring together data from multiple systems into one comprehensive dashboard, providing a holistic view of business performance.
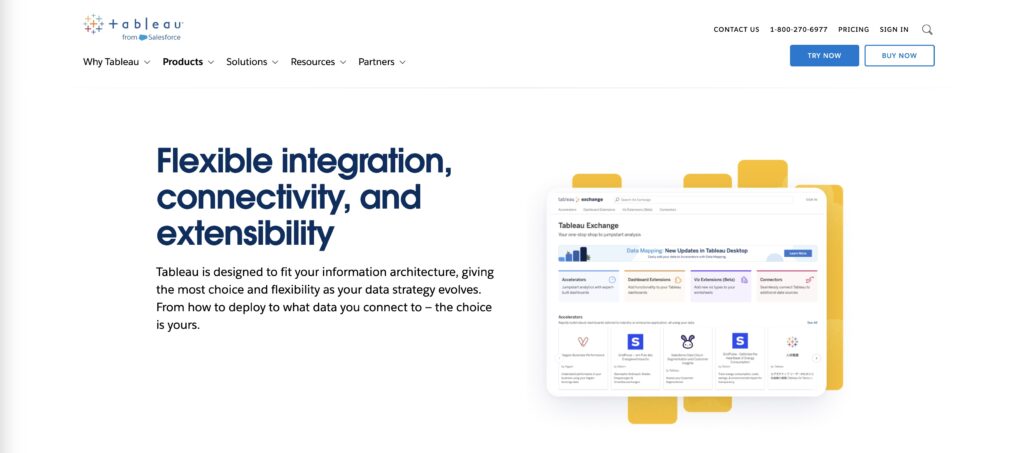
Tableau’s integration with Salesforce further strengthens its appeal for businesses that rely on CRM data, allowing sales teams to leverage customer insights directly in their analytics.
Deployment and Cloud Capabilities: Quicksight vs Tableau
When it comes to deployment options, Quicksight benefits from being a fully managed, cloud-native service. This makes deployment and maintenance incredibly easy, especially for businesses that don’t want to worry about managing infrastructure. Because Quicksight is hosted in AWS, businesses can deploy it globally and enjoy fast, reliable performance without the need for local servers.
Tableau offers more deployment flexibility, allowing businesses to choose between on-premise, cloud-hosted, or hybrid setups. This is a major benefit for companies that need control over their data storage due to compliance or security reasons. With Tableau, organizations can decide where and how their data is hosted, which adds an extra layer of flexibility compared to Quicksight’s fully cloud-based environment.
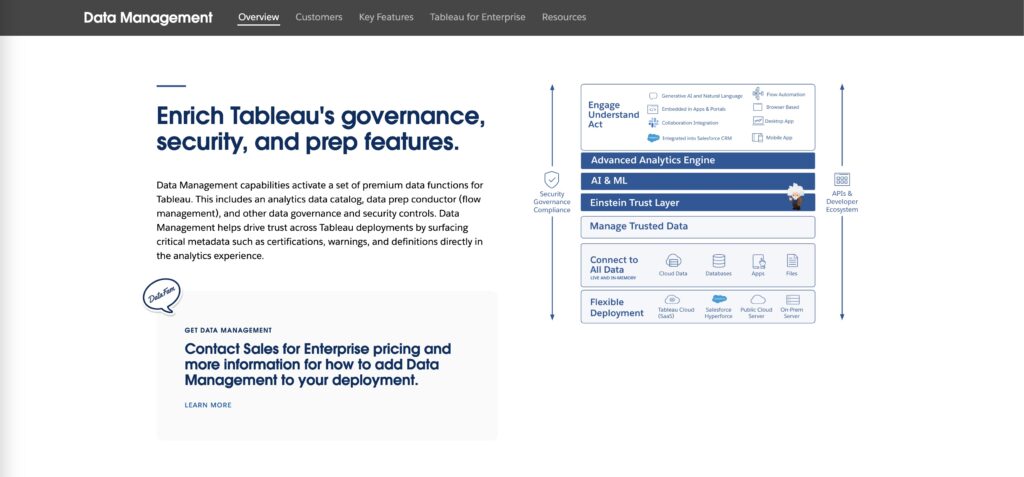
Tableau’s cloud service, Tableau Online, is also a viable option for businesses that prefer a managed service similar to Quicksight’s, allowing them to access all Tableau features without worrying about server maintenance.
Advanced Analytics and Machine Learning: Quicksight vs Tableau
In the Quicksight vs Tableau comparison, Tableau stands out for its advanced analytics capabilities. It’s a powerful tool for creating complex calculations, running predictive models, and integrating with machine learning (ML) frameworks. Tableau users can perform statistical analyses like trend lines, forecasting, and clustering, which provide deeper insights into data trends and patterns. Tableau’s integration with R and Python allows data scientists to incorporate machine learning models directly into dashboards, enabling businesses to create advanced visualizations based on sophisticated algorithms.
Quicksight, on the other hand, focuses on simplicity, offering pre-built ML-powered insights for users who don’t need or want to build their own models. Quicksight’s machine learning capabilities, while less customizable than Tableau’s, are still valuable for businesses that want to leverage AI without a dedicated data science team.
Collaboration and Sharing Features: Quicksight vs Tableau
Collaboration is a critical component of business intelligence tools, and both Quicksight vs Tableau excel in this area but in different ways. Quicksight’s cloud-based platform ensures that team members can access reports from anywhere, and sharing is as simple as sending a URL. Its straightforward sharing options are perfect for small businesses that need to collaborate quickly without the complexity of setting up user roles or permissions.
Tableau, however, offers more robust collaboration features, especially in an enterprise setting. With Tableau Server or Tableau Online, businesses can control user roles, manage permissions, and ensure that sensitive data is only accessed by the right team members. Tableau also allows for version control and collaborative editing, making it ideal for teams working on large, complex reports simultaneously.
Pricing Breakdown: Quicksight vs Tableau
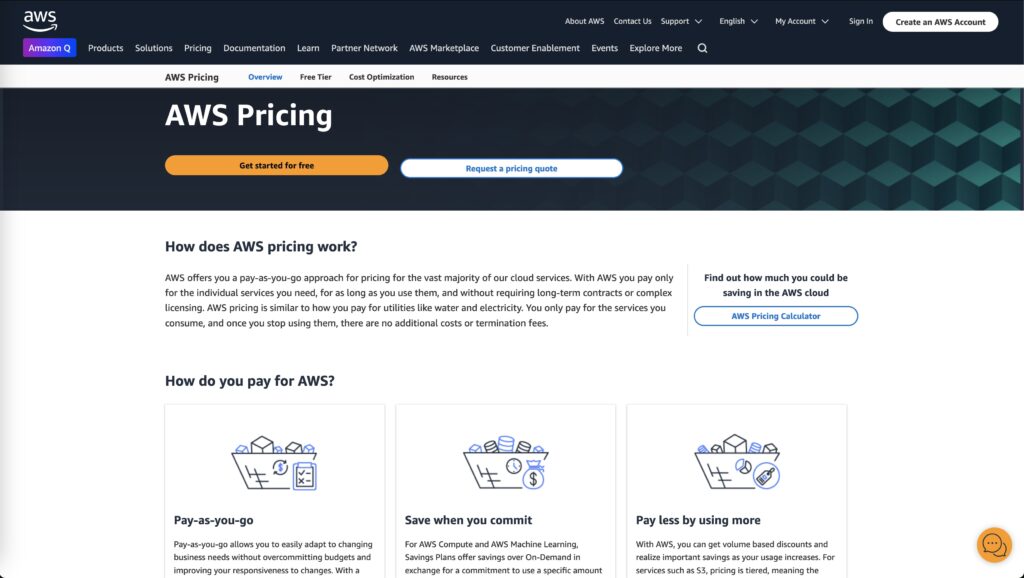
In terms of pricing, Quicksight vs Tableau cater to different business models. Quicksight’s pay-per-session pricing structure makes it an affordable option for businesses that don’t need to use the tool frequently. This is particularly appealing to smaller organizations or startups that want the flexibility to scale up without a huge initial investment.
Tableau’s subscription-based pricing model, on the other hand, provides access to its full range of features but comes at a higher price point. Larger enterprises typically find Tableau’s pricing justifiable due to the advanced features, scalability, and customizability it offers. Tableau provides different pricing tiers depending on whether you’re using Tableau Online, Tableau Server, or Tableau Public, so businesses have some flexibility in how they invest.
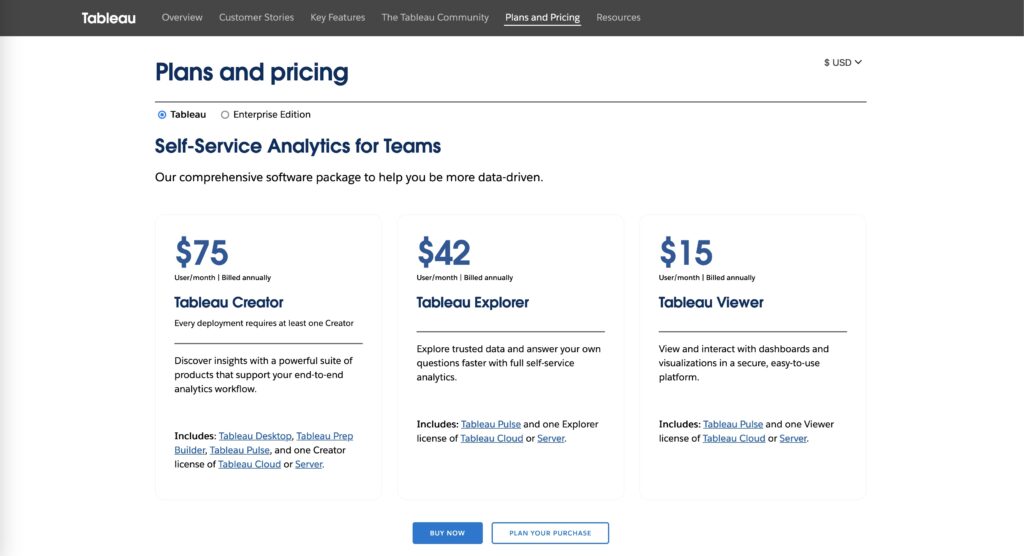
While Quicksight is generally more cost-effective for smaller businesses, Tableau offers a better ROI for organizations that need comprehensive BI solutions and have the budget for a higher initial investment.
Which BI Tool Fits Your Business Stage? Quicksight vs Tableau?
For Startups and Small Businesses
For startups and small businesses, resources are often limited, both in terms of budget and staff. You might have small teams handling multiple roles, with little time to invest in learning complex tools. If that sounds like your business, Quicksight may be the perfect fit.
With Quicksight, you don’t need a dedicated data team to get started. Its user-friendly interface and straightforward analytics capabilities mean that even non-technical users can quickly create reports and visualizations. The pay-per-session pricing model is a significant advantage for startups because it allows you to scale your use of the tool as your business grows, without the financial burden of a large upfront investment. You only pay for the sessions you actually use, making it a highly cost-effective solution for businesses that are still experimenting with data-driven decision-making or those that have sporadic BI needs.
Additionally, if your startup is already using AWS infrastructure, Quicksight’s seamless integration with AWS services like S3 and Redshift can save valuable time and resources. You won’t need to manage complex integrations, and you can leverage the power of Amazon’s machine learning insights to gain valuable predictions and trends in your data without needing a full-fledged data science team.
However, one limitation you should be aware of is that as your business starts to scale, Quicksight’s more basic data visualizations may no longer meet your growing needs for in-depth analysis and custom reporting. That’s where Tableau might eventually come into play.
For Medium-Sized Businesses
As a medium-sized business, your needs are likely more complex than a startup, but you still need tools that are efficient, easy to manage, and won’t require a team of full-time data scientists. Both Quicksight and Tableau could work for your business, but the best choice depends on how much flexibility and depth you need from your BI tools.
If your business is expanding its data needs but you’re still largely using AWS infrastructure, Quicksight can continue to serve you well. You’ll benefit from its machine learning capabilities and can continue scaling the tool as your data grows. Quicksight’s pay-as-you-go pricing is still an attractive option at this stage, particularly if you don’t need highly customized reports.
However, many medium-sized businesses start to demand more customization and advanced reporting features, and this is where Tableau begins to shine. Tableau offers extensive flexibility for building interactive dashboards, customized reports, and deeper analytics. As your teams become more familiar with data-driven insights, Tableau can empower them to ask more complex questions and get granular with their data, leading to more informed and strategic decisions.
Tableau’s ability to integrate with a broader range of databases and tools (such as Google Analytics, Salesforce, and SQL) can help mid-sized businesses that work with various data sources. This ensures that you’re not siloed into one ecosystem, and you can combine insights from multiple platforms into one cohesive view. At this stage, investing in a tool like Tableau might be worthwhile, especially if your business has started allocating resources toward analytics and strategic growth.
For Large Enterprises
For large enterprises, data is not just a tool—it’s the lifeblood of strategic decision-making. Large organizations typically have dedicated analytics teams, multiple data sources, and a constant need for real-time, actionable insights that can be customized for various departments and stakeholders.
Tableau is the go-to solution for these scenarios. While Quicksight offers affordability and simplicity, it doesn’t provide the deep level of customization or scalability that large enterprises require. Tableau’s ability to integrate with almost any data source, create highly interactive, real-time dashboards, and provide granular control over visualization and analytics makes it the ideal choice for large-scale data operations.
For instance, in large enterprises, it’s common to have data from multiple sources—whether it’s customer data from a CRM system like Salesforce, operational data from an ERP, or financial data from accounting software. Tableau allows you to pull all of this data into one place and create dashboards that can be shared across departments, empowering leaders at every level of the organization to make data-driven decisions.
Additionally, Tableau’s deployment flexibility is critical for large enterprises that need to adhere to strict security and compliance regulations. Tableau Server allows for on-premise data hosting, providing businesses with complete control over their data. This is particularly beneficial for organizations in highly regulated industries like healthcare, finance, or government, where data privacy and compliance are paramount.
Another aspect that makes Tableau ideal for enterprises is its collaboration capabilities. Large organizations often have multiple teams working on different aspects of data analysis, and Tableau’s version control, permissions management, and collaboration tools allow for seamless teamwork. Analysts can build dashboards that executives can then explore, manipulate, and filter to get insights that are most relevant to their specific needs.
Conclusion: Quicksight vs Tableau – Which One Wins?
While Quicksight offers simplicity, cost-effectiveness, and integration with AWS, it lacks the depth, flexibility, and advanced features that Tableau offers. If your business has relatively straightforward reporting needs and is already embedded in the AWS ecosystem, Quicksight could be the ideal solution. But if you require customized visualizations, complex integrations, and deeper analytics, Tableau provides a more comprehensive solution—albeit at a higher cost.
In conclusion, choosing between Quicksight vs Tableau should not be seen as a simple either/or decision. Rather, it’s about selecting the tool that best aligns with your business’s current stage, growth trajectory, and data strategy. Quicksight can provide the agility and affordability you need to get started, while Tableau offers the depth and power you’ll need as your business—and data needs—evolve.
By carefully considering your business’s needs today, and where you expect to grow in the future, you can ensure that your choice of BI tool will drive better, data-informed decisions for years to come.
3 Alternative BI Tools to Consider
If Quicksight vs Tableau isn’t quite hitting the mark for your business needs, here are three alternative BI tools worth considering:
- Power BI – Microsoft’s Power BI is a great alternative to Tableau, offering powerful analytics and integration with Microsoft products at a more affordable price.
- Looker – Looker is another excellent cloud-based BI tool that offers strong data modeling capabilities, and it’s perfect for businesses already integrated with Google Cloud.
- Qlik Sense – Known for its associative model and advanced analytics capabilities, Qlik Sense is a great alternative for those who want to explore data from different perspectives.

